πŸŽ‰ All-in-One Billing, Inventory & Accounting Platform for Faster Business Growth BUY NOWs πŸ‘‰

Download Profit and Loss Statement Format

Stay on top of your business finances with a clear Profit and Loss statement. Monitor revenue, expenses, taxes, interest, and overall profitability to make confident business decisions. With Raseed, generate accurate P&L statements and instantly know whether your business is operating at a profit or a loss.

Get Detailed Accounting Insights with P&L Statement


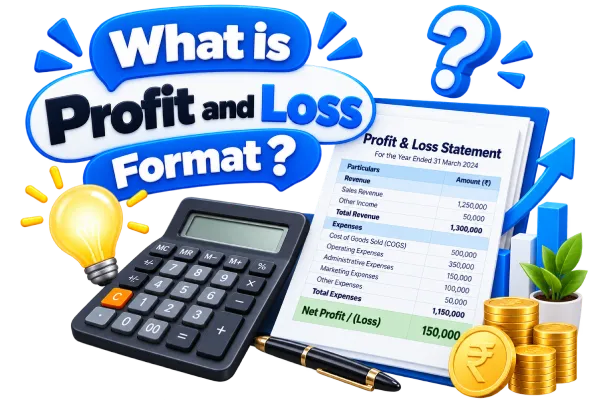
What is P&L Format?

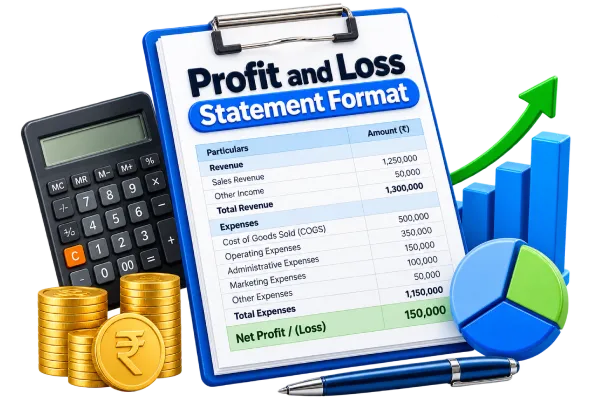
An important financial record that shows a company's financial success over a given time period, usually quarterly or annually, is the profit and loss statement format.

It offers information on revenues, expenses, and costs that show whether a business has made money or lost money over the specified time frame.

Features of Profit and Loss Statement Report

Automated Calculations

Our billing and accounting software simplifies financial reporting by calculating revenue, expenses, and net profit automatically. This minimizes manual errors and saves significant time.

Tax Compliance

P&L statements are used to ensure audit-ready files, easy income tax filing, adherence to GST standards, and detailed reporting with all information.

Integration with Inventory and Sales

Raseed integrates with inventory and sales data for comprehensive financial analysis, without depending on multiple tools.

User-Friendly Interface

The intuitive design of Raseed accounting software makes it easy for users with minimal or no accounting knowledge to generate detailed P&L statements.

Performance Analysis

Data analysts and investors who have spent on your business use profit and loss statements to spot out the financial performance of your company and the growth opportunities.

Decision Making

Based on the trend analysis with the P&L statements, Raseed helps to find out the popular services or products and plan better for further enhancement.

Mobile Friendly

With Raseed, business owners can actually view the profit and loss statements even when they are away from office or while they are on the go.

Forecasting

By comparing the income statement format with previous performance history and with balance sheets you can draft strategies for further budgeting.


Steps to View Your Profit and Loss Reporting

Step 1

Select the accounting period that you wish to report on. Usually, a P&L statement is produced for a quarter, year, or month.

Step 2

List all the money your company has made throughout the chosen period. This covers interest earned as well as core sales of goods and services.

Step 3

Subtract any direct expenses incurred in producing your goods or rendering your services. Inventory, direct labor, and raw supplies are all involved.

Step 4

Gather all of your administrative expenses, including both fixed and variable costs such as software subscriptions, utilities, liabilities, purchases, sales, and marketing.

Step 5

Lastly, deduct from your operational earnings any leftover non-operating expenses, such as taxes, interest, and depreciation.

Core Highlights of a Profit and Loss Statement

The profit and loss statement format highlights 8 core financial aspects that monitor a company's financial performance from its top-line earnings down to its bottom line.

Revenue
Cost of Goods Sold (COGS)
Gross Profit
Operating Expenses
Operating Income
Non-Operating Items
Pre-tax Profit
Net Profit

Different Formats for Profit and Loss Accounts

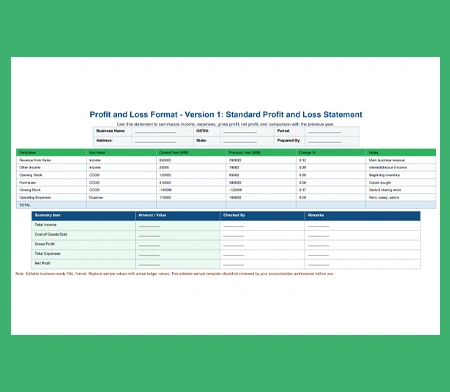
The formats of profit and loss accounts differ based on the type of business, the accounting procedures used, and the reporting objective. The main categories of P&L are as follows:
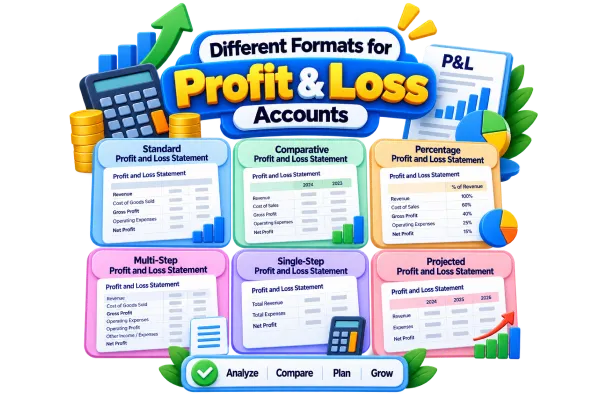
Horizontal P&L Format: It displays credits and debits side by side. All costs and losses (debits) are listed on the left, and gains and revenues (credits) are displayed on the right.

Vertical P&L Format: With revenue at the top and expenses gradually subtracted to determine net profit or loss, this format arranges elements consecutively in a single column.

Classified P&L Format: For in-depth analysis, items are categorized. While expenses are separated into direct costs (COGS) and indirect expenses, income is separated into operating and non-operating revenue.

Comparative P&L Structure: For trend analysis, this style arranges several periods or entities side by side. Financial data for various departments or years are shown in columns.

Condensed P&L Format: Major income and cost categories are summarized in this high-level format, which emphasizes important financial insights with few details (for annual reports).

Comprehensive P&L Format: Every income and spending item is broken down in this thorough style, which includes a summary of all accounts, sub-accounts, and line items.
FAQs

P&L statements are typically prepared monthly, quarterly, and annually to track financial health and tax reporting.
Variance analysis compares current P&L data to historical periods or a budget to identify unexpected revenue drops or spending spikes.
Operating revenues and expenses result from the company's primary business activities. Non-operating items are peripheralβ€”such as interest earned on bank accounts, interest expense on debt, or investment gains.
A single-step P&L computes net income in a single computation by combining all sales and expenses. A multi-step approach separates revenues and expenses into operating and non-operating categories, computing operating income and gross profit independently.
The term "cost of goods sold" means direct expenses, such as materials and direct labor, related to the manufacture of the commodities that a business sells.
Raseed paths